This post is cowritten with Ilija Subanovic and Michael Rice from Workhuman.
Workhuman’s customer service and analytics team were drowning in one-time reporting requests from seven million users worldwide—a common challenge with legacy reporting tools at scale. Business intelligence (BI) admins faced mounting pressure as their teams became overwhelmed with these requests. By rebuilding their analytics delivery with Amazon Quick Sight dashboards, they eliminated the manual report generation bottleneck for customer-specific requirements. With this change customers gain custom reporting capabilities. Workhuman is a global leader in human capital management (HCM) software and specializes in employee recognition and engagement solutions. By using Workhuman solutions, employees can recognize and reward each other, fostering authentic human connections in the workplace.
This post explores how Workhuman transformed their analytics delivery model and the key lessons learned from their implementation. We go through their architecture approach, implementation strategy, and the business outcomes they achieved—providing you with a practical blueprint for adding embedded analytics to your own software as a service (SaaS) applications.
Workhuman delivers SaaS capabilities for social recognition, continuous performance management, and employee experience analytics to enterprise clients. With dual headquarters in Dublin, Ireland, and Framingham, Massachusetts, Workhuman serves over seven million users across 180 countries, supporting more than one million recognition moments monthly.
The business challenge
As Workhuman scaled to serve users worldwide with legacy reporting tools, their customer service and analytics teams became overwhelmed by an unsustainable volume of manual, one-time reporting requests. This reactive model created several critical issues:
- Resource constraints: Manual report generation consumed significant team time, leading to delays in data delivery and increased operational costs. Each request for a custom report required developer involvement, creating a bottleneck that slowed down Workhuman’s ability to serve customers effectively.
- Limited flexibility: Reports delivered to customers weren’t customizable to their specific needs. Modifications required additional development resources, restarting the cycle.
- Lack of self-service: Customers couldn’t independently explore and visualize their own data. The dependency on internal teams created friction, reduced agility, and impacted customer satisfaction.
- Access control gaps: Without a robust mechanism for administering reporting access or managing data privileges securely, Workhuman faced both security risks and operational complexity as their customer base grew.
Workhuman needed to build a solution to solve their unique need to deliver reporting at scale while empowering customers to manage it themselves.
Solution overview
Workhuman needed to provide intuitive reporting experiences to program managers, HR professionals, and people leaders so they could create custom visualizations as needed directly in the reporting product—all while respecting HR administrators’ need to enforce granular reporting authorization privileges and maintain personalized dashboard access based on each user’s authorization level.
Workhuman developed a comprehensive self-service analytics platform that addresses the unique challenges of multi-tenant SaaS environments with architecture patterns that maintain strict data isolation across customers while maximizing resource efficiency. The solution was designed to empower both Workhuman’s internal and customer users to independently explore, analyze and visualize their curated recognition datasets for various insights. A key strength of Workhuman’s implementation is the strategic use of Quick Sight embedded dashboards in existing applications, followed by automation approaches that scale analytics deployment across an entire customer base without manual intervention.
The solution covers the row-level security techniques used to adopt fine-grained access control within each tenant’s environment, complemented by continuous integration and continuous delivery (CI/CD) practices for managing analytics assets across development, staging, and production environments. Additionally, the solution showcases the real-world business outcomes Workhuman achieved, including reduced operational overhead and improved customer satisfaction metrics that validate the investment in self-service analytics.
Workhuman selected Quick Sight for its multi-tenancy and asset isolation features that directly addressed their challenges:
- Multi-tenant architecture: The namespace functionality in Quick Sight creates logical isolation for each customer organization, providing strict separation of analytics assets at the namespace level and user management while maintaining strict data boundaries—a foundational requirement for any multi-tenant SaaS solution.
- Embedding capabilities: The embedding SDK and API-first approach let Workhuman control the user experience while tapping into Quick Sight analytics. Development teams can customize the look and feel to match their application’s branding and user interface pattern.
- Row-level security: Access controls help users only see data they’re authorized to view based on their role in the organization.
- API-driven automation: Quick Sight APIs enable programmatic management of analytics deployment aspects, supporting efficient management of analytics assets across an entire customer base without manual intervention for each customer.
Architecture overview
A multi-tenant analytics solution requires several key components working together to provide a secure, segregated analytics experience. Workhuman’s architecture orchestrates these components through a carefully designed workflow that balances isolation with operational efficiency. The architecture uses dedicated namespaces for each customer while using shared infrastructure and templates to reduce complexity.
Workhuman structured their approach around these components:
- Admin Hub and Reporting: The central application provides embedded Quick Sight dashboards and manages user access
- Quick Sight namespace management: Dedicated namespaces for each tenant maintain isolation
- Analysis creation and management: Master templates and customer-specific analyses
- Dashboard publication: Analyzes published as dashboards for customer user consumption and customization through authoring experience.
- Dataset management: Datasets with appropriate customer-specific filtering
- Dashboard embedding: Secure embedding URLs integrated into the application
- Dashboard authoring: Users can create customized copies of existing analyses
Workhuman’s AWS account serves as the central hub, housing the default namespace for internal operations and templated assets with predefined datasets and analysis tools. During onboarding, each customer receives dedicated segments that manage their specific assets, including filtered datasets tailored to their unique data requirements.
The Admin Hub and Reporting application handles user management, authentication, and authorization, interacting with templated assets to publish dashboards and analyses using an API. An Amazon Aurora PostgreSQL database supports backend operations, storing and managing customer data securely.
The architecture confirms that each customer operates within their own isolated environment, with dedicated resources and data access controls, while using shared infrastructure and tools for efficiency and cost-effectiveness.
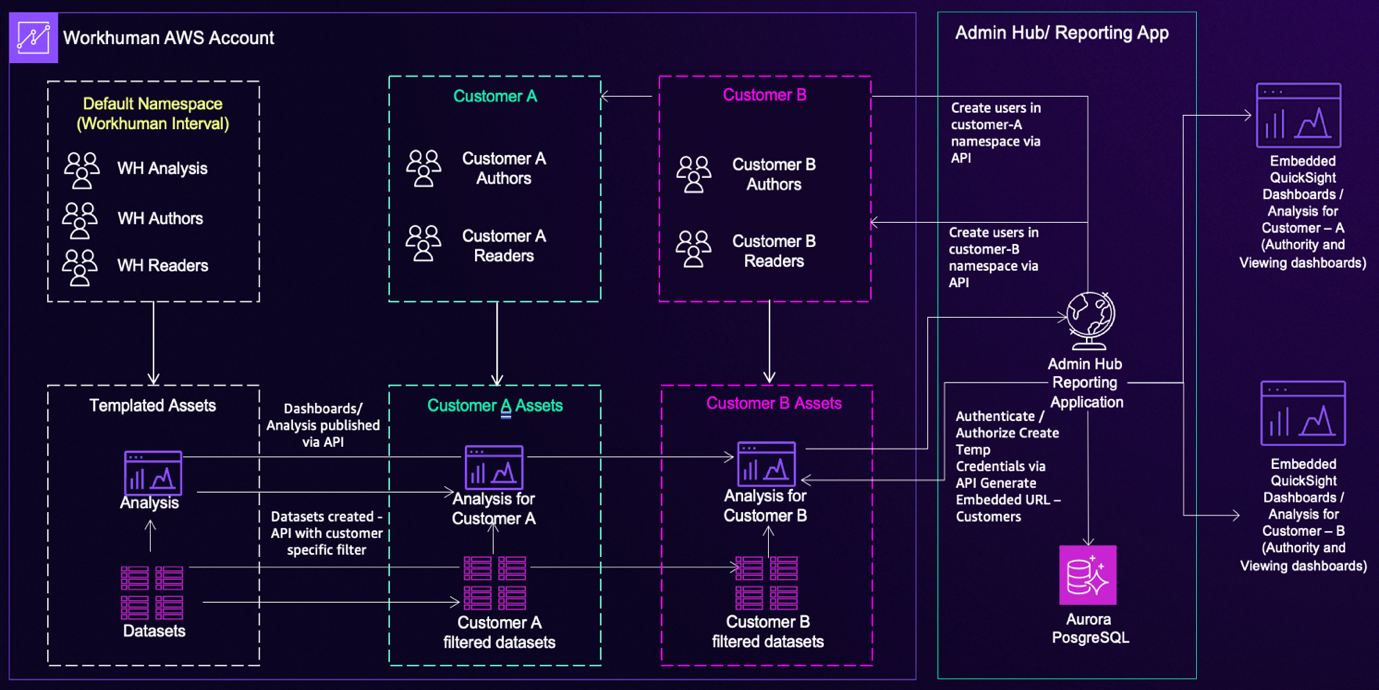
Workhuman developed this structured workflow, shown in the preceding figure:
- Manage user identities in Quick Sight: Create each customer authoring user within a Quick Sight group in a custom namespace
- Create master analyses: Analysts build master analyses for relevant product feature areas based on core model datasets
- Duplicate for customers: Copy analyses for each customer and share them with relevant customer Quick Sight groups
- Create filtered datasets: Build customer-specific datasets with customer-specific filters and share them with Quick Sight customer authoring groups
- Update analyses: Modify customer-specific analyses to use datasets with customer-specific filters
- Publish dashboards: Generate customer dashboards from the analyses with updated datasets
- Manage authorization: The application layer manages user configuration and performs authorization checks, provisioning users via API when authorized
- Generate embedded URLs: Quick Sight generates authoring embedded URLs for customer-specific analyses
- Render in UI: The embedded URL renders in the user interface
Technical implementation
Workhuman’s implementation uses three core Quick Sight features: namespace isolation for tenant separation, template-based customization to maintain consistency, and row-level security access control. Each component builds on the architectural foundation described earlier, working together to create an analytics platform that scales efficiently while maintaining strict security boundaries.
Namespace isolation
Each customer organization receives a dedicated namespace in Quick Sight Enterprise Edition. Each namespace contains one tenant’s resources, preventing customers from accessing each other’s data or analytics. Namespaces provide the foundational layer of user isolation required for multi-tenant SaaS applications, providing logical separation of each customer organization’s users, assets, and data remain logically separated with boundaries that Quick Sight enforces automatically
Master templates and customization
Master analysis templates include standard KPIs, visualizations, branding, and placeholder filters. During customer onboarding, automation generates customer-specific versions from these templates, and the deployment automation framework then automatically generates Quick Sight assets, creating consistency while reducing manual effort.
Row-level security
Row-level security (RLS) restricts data access within each customer’s namespace based on user roles. RLS rules filter data using column values that match user attributes. Row-level security complements namespace isolation by restricting data visibility within each customer’s environment based on user roles and permissions.
Secure dashboard embedding
Dashboard embedding generates secure, time-limited URLs for each user session. Workhuman customized the interactivity options and integrated with their existing authentication system.
Dashboard authoring
Customers users with authoring experience can create customized versions of embedded Quick Sight analyses through a custom-developed process:
- Create a copy of the original analysis using the Quick Sight API
- Define RLS rules for the analysis
- Create a Quick Sight group associated with the given RLS permissions using the API
- Add users to the Quick Sight group
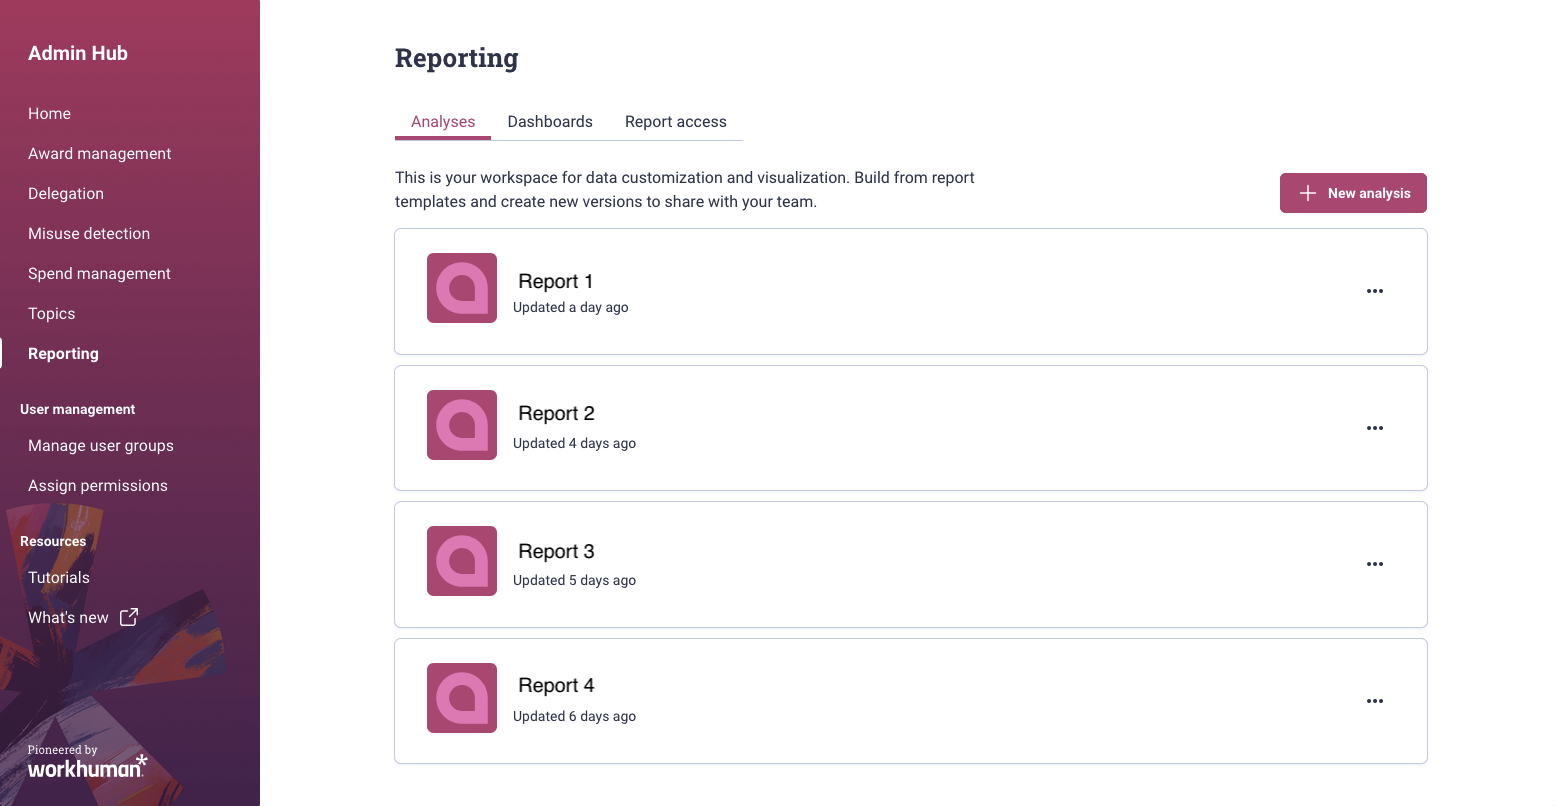
The process verifies that each custom analysis has associated permissions and groups, allowing users to belong to different Quick Sight groups with different RLS permission sets for different analyses.The following image shows the Reporting Admin home page listing all available analyses.
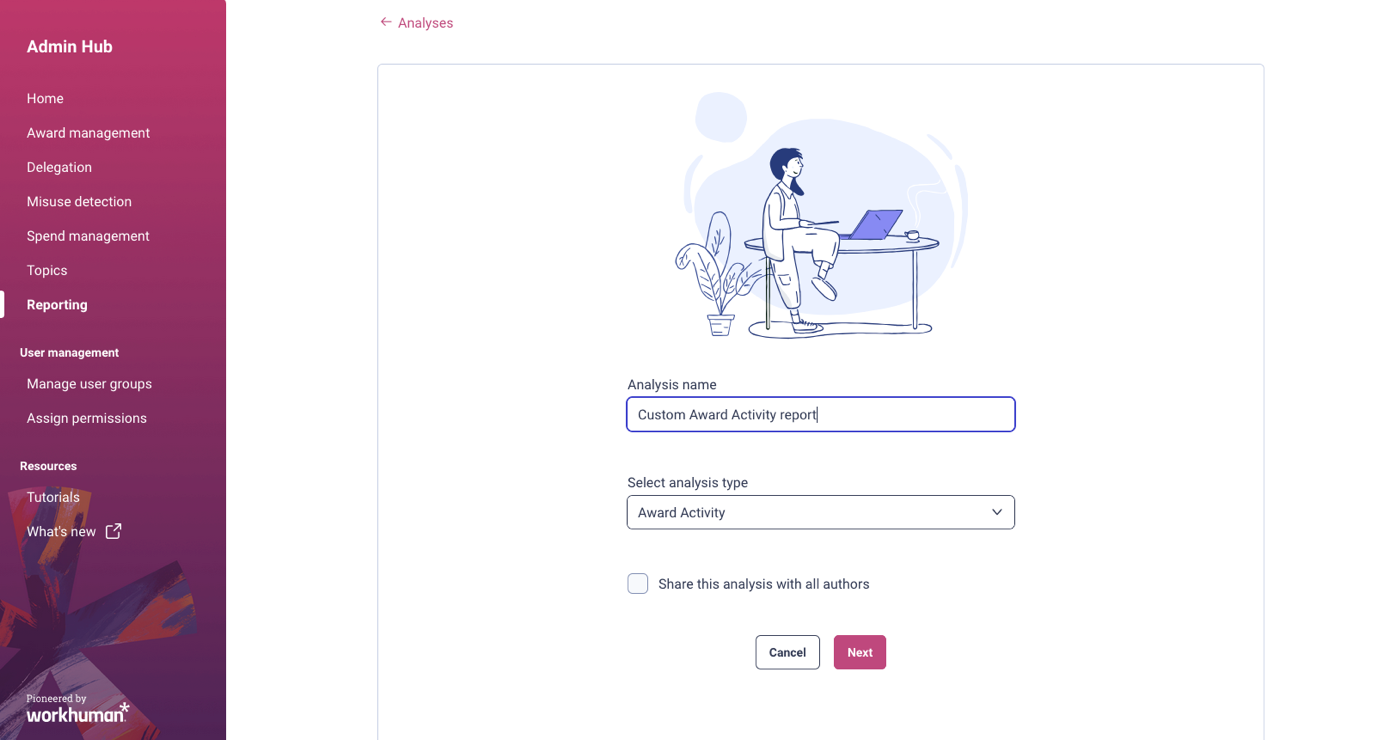
To create a custom analysis, customer users enter the analysis name and select the analysis type in the dialog box. They then choose a pre-created analysis to use as a template.
Static and dynamic asset management
Workhuman’s implementation distinguishes between two types of Quick Sight assets, each managed differently based on their lifecycle and update frequency.
- Static assets: Namespaces, standard analyses, dashboards, folders, and author groups stay relatively stable across customers. Python scripts using the Quick Sight API generate these assets automatically. The automation monitors the status of Quick Sight assets for each client, validates analysis definitions, detects source definition updates, and automatically provisions assets upon detection of new client IDs. Client report data comes from a centralized Amazon Redshift table. During Quick Sight dataset creation, the system applies client-specific filters based on client ID to maintain data isolation.
- Dynamic asset management handles resources associated with Quick Sight analysis authoring experiences—custom analyses created by users and the associated permissions. The frontend application uses the Quick Sight API, so that users can create new analyses and manage their lifecycle. A PostgreSQL database stores RLS permission sets and analysis metadata.
During custom analysis creation, the UI dialog lists available analyses for customization. Users define RLS permissions derived from available columns and values in the dataset. Permissions are inserted into the RLS database and linked to the dataset. The analysis is created, and a new Quick Sight group is created.
The separation between static and dynamic assets means that Workhuman can maintain centralized control over standard templates while providing flexibility for customer-specific customizations.
CI/CD pipeline
The deployment pipeline automates Quick Sight asset updates across three stages. The three-stage approach balances development agility with production stability:
- Development: Analysts create and test new dashboard templates in an isolated environment
- Staging: Templates undergo testing with production-like data to identify issues before customer exposure
- Production: Validated templates deploy to customer namespaces
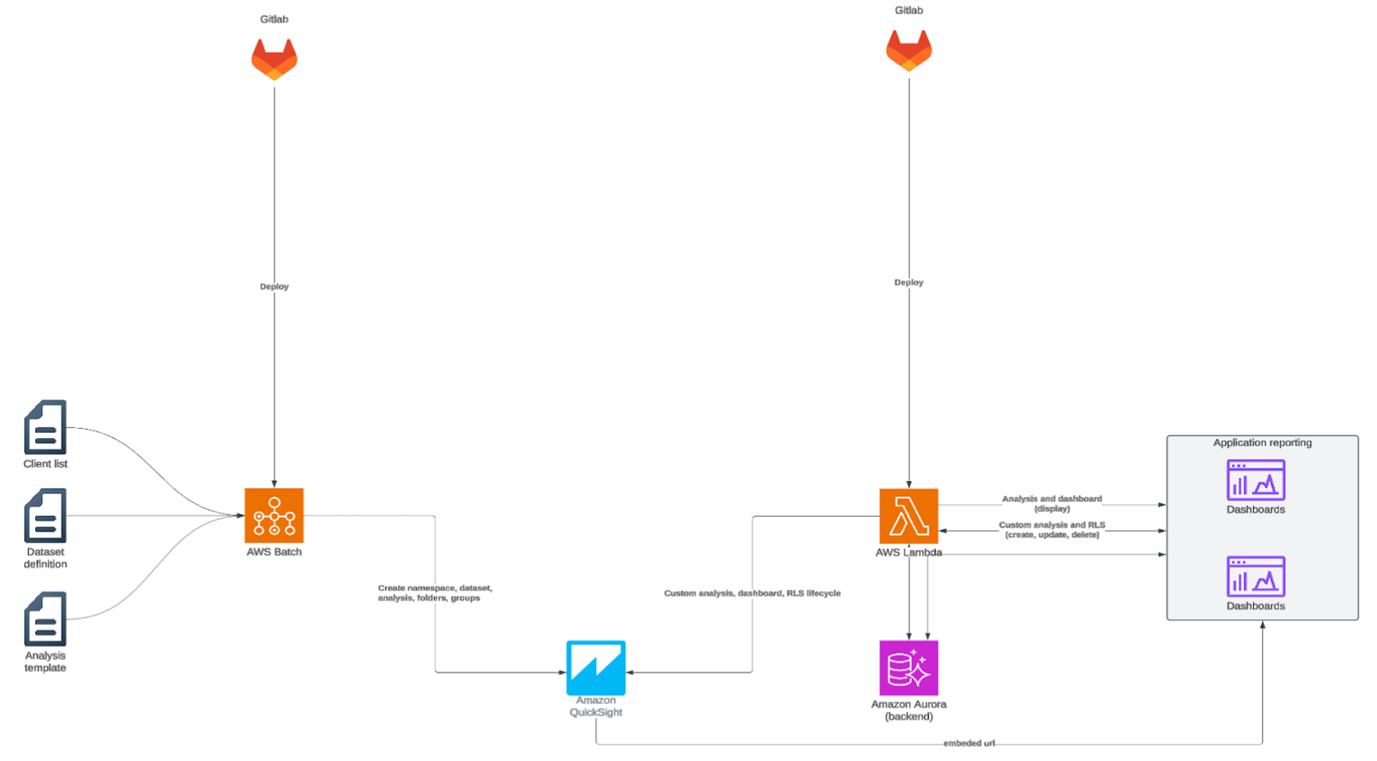
The pipeline includes approval gates between stages and rollback capabilities in case issues are detected. Terraform deploys infrastructure, while AWS Lambda functions and AWS Batch processes execute Quick Sight asset creation automation.
The following image is the CI/CD pipeline workflow. The architecture demonstrates an automated deployment workflow that integrates GitLab version control with AWS services such as AWS Batch, Amazon Quick Sight, Amazon Lambda, and Amazon Aurora to manage analytics dashboards and reporting.
Data sources
Amazon Redshift serves as the primary data source for reports. Dedicated extract, transform, and load (ETL) workflows create underlying Amazon Redshift tables. To maintain current data, Quick Sight dataset refreshes trigger automatically following Redshift table updates using the refresh dataset API. Amazon CloudWatch metrics track refresh timestamps, data row counts, and processing duration. Dashboards and alerting mechanisms monitor dataset freshness and help verify data reliability.
Customer-facing dashboards
The Workhuman dashboards powered by Quick Sight provide customers with actionable insights from employee recognition data. These dashboards demonstrate the types of analytics Workhuman’s customers can access and customize:
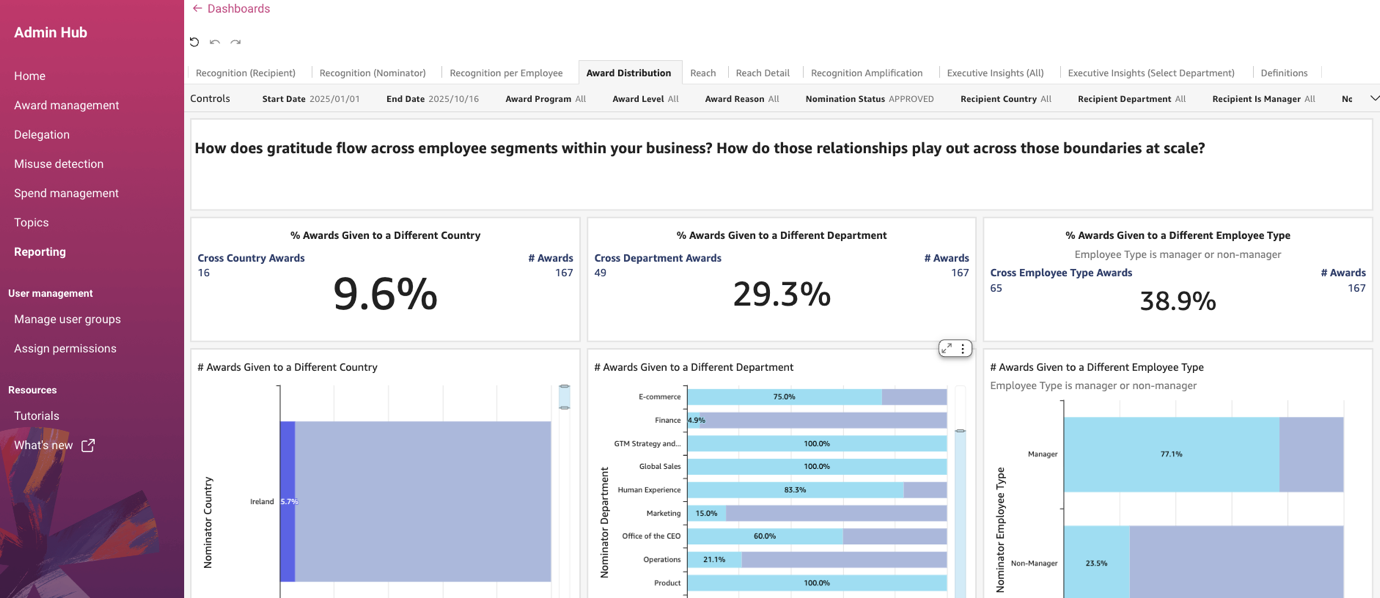
Award Distribution dashboard: The dashboard, shown in the following screenshot, tracks recognition reach across the organization. The metric showing 29.3% of awards given to individuals in different departments highlights recognition’s role in fostering cross-functional collaboration. Organizations can use these metrics to identify gaps in recognition coverage and track program effectiveness over time.
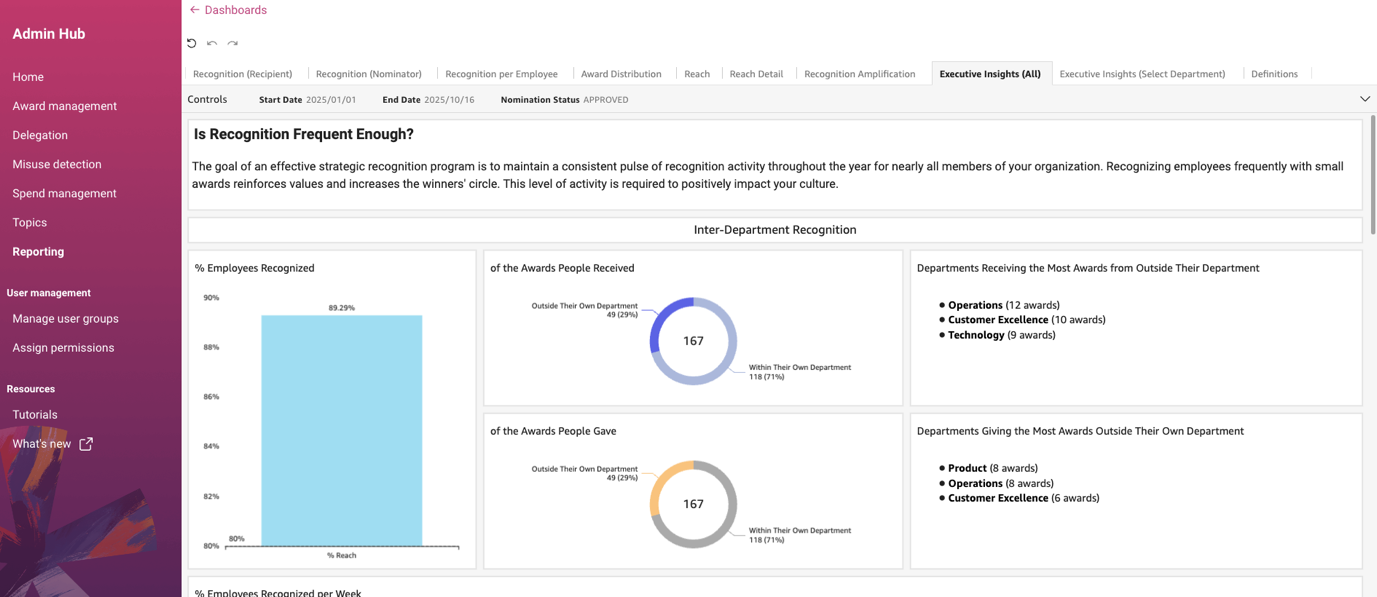
Executive Insights dashboard: The view, shown in the following screenshot, focuses on inter-departmental recognition patterns. In the example shown, 89.29% of employees have received recognition, indicating strong program adoption and shows departments like Operations, Customer Excellence, and Technology actively receiving awards from outside their teams, indicating healthy cross-functional appreciation. Executives use this dashboard to assess organizational culture health and identify departments that may need encouragement to participate more actively in recognition programs.
Recognition (Recipient) dashboard: The analysis identifies which awards and employees most influence company culture. The example, shown in the following screenshot, highlights non-managerial employees as significant contributors to recognition culture. The insight helps organizations understand that culture-building isn’t limited to leadership roles and can inform recognition program design.
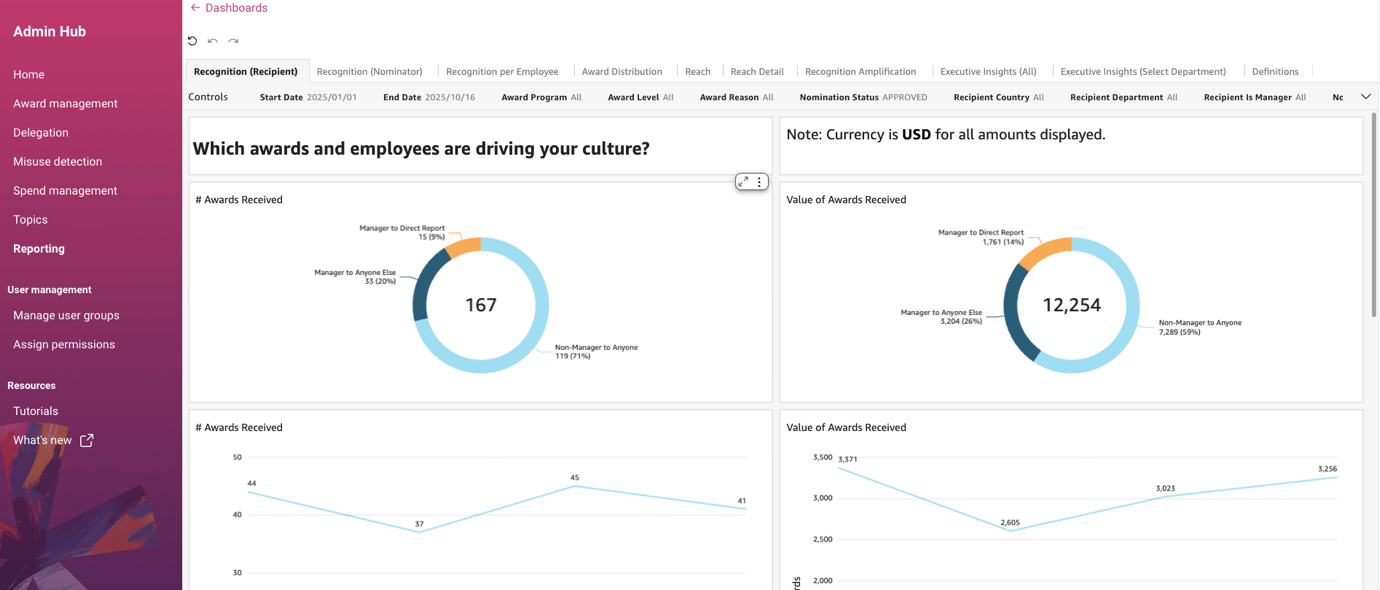
Recognition per Employee dashboard: This dashboard analyzes recognition activity by employee segments including country, department, and managerial status. Organizations use this view to identify and address disparities in recognition distribution, confirming equitable program participation across different employee populations. Note: Currency is USD for amounts displayed in the dashboard examples.

Benefits and results
Workhuman’s self-service platform cut custom reporting requests dramatically:
- Reduced custom reporting requests: Customers now create and modify their own reports, freeing up the development team for other work.
- Improved customer satisfaction: Self-service analytics capabilities received positive feedback from Workhuman’s customers, who appreciate the flexibility and control. Empowering customers with self-service tools improved their overall experience with the product.
- Faster time-to-insight: Users can access and analyze data immediately rather than waiting for custom reports, changing how customers interact with their data and make decisions.
- Scalable solution: The multi-tenant architecture supports a growing customer base without requiring proportional increases in development resources. As new customers join, automated provisioning handles the complexity.
- Reduced development time: The automated CI/CD pipeline deploys new analytics features more quickly. What previously took weeks of custom development can now be rolled out across the customer base in days.
The solution also freed up development resources that were previously dedicated to fulfilling custom reporting requests, allowing Workhuman to focus on core product innovation.
Looking to the future
Workhuman plans to add more dashboard customization options, new visualization types for their specific use cases, chat agents, Pixel Perfect Reports, deriving insights from unstructured data and expanded API capabilities.
Conclusion
Workhuman’s implementation of Amazon Quick Sight demonstrates how organizations can deliver powerful self-service reporting capabilities while maintaining strict multi-tenant data isolation in SaaS applications. By using Quick Sight enterprise features, teams can create scalable solutions that improve customer satisfaction and reduce development overhead.
Key takeaways
Apply these key lessons from Workhuman’s experience:
Use namespaces to separate tenants: This is foundational for multi-tenant analytics.
- Implement row-level security for data governance: Add row-level security for additional data governance within namespaces, helping to verify that users see only their authorized data.
- Create master templates for consistency: Build master templates to maintain consistency while allowing customization, balancing standardization with flexibility.
- Automate deployment through CI/CD: Implement a robust CI/CD pipeline to automate deployment and testing. Automation is critical for managing analytics assets at scale across multiple customers.
- Use embedding capabilities for native experience: Take advantage of the embedding capabilities provided by QuickSight to integrate analytics naturally into applications, creating a cohesive user experience.
Learn more
To learn more about implementing embedded analytics with Quick Sight:
- Embedding Amazon Quick Sight dashboards
- Working with namespaces in Amazon Quick Sight
- Row-level security in Amazon Quick Sight
- Join the Quick Sight Community to connect with our global network of Community members of all experience levels and user identities to further your education