In healthcare, the ability to quickly analyze and interpret medical reports is crucial for both healthcare providers and patients. While medical reports contain valuable information, they often remain underutilized due to their complex nature and the time-intensive process of analysis. This complexity manifests in several ways: the interpretation of multiple parameters and their relationships (such as various blood cell counts), the comparison of test results against standard reference ranges, and the need to analyze trends in health parameters over time. To address this challenge, we’ve conceptualized a medical reports analysis dashboard that illustrates how healthcare providers could enhance their interaction with medical data through a sample implementation
In this post, the created dashboard represents a convergent solution that brings together the power of Amazon Bedrock advanced AI capabilities, LangChain‘s document processing, and Streamlit‘s intuitive user interface. By using these technologies, we’ve created a system that not only stores and displays medical reports, but actively helps interpret them through natural language interactions and dynamic visualizations.
Solution overview
At the solution’s foundation are various large language models available through Amazon Bedrock, including Anthropic’s Claude series and Amazon Nova Foundation Models. You can select from options such as Claude Opus 4.1, Claude 3.7 Sonnet, Amazon Nova Pro, and others, each optimized for different performance and capability requirements. The chosen model processes natural language queries with medical context awareness, enabling detailed interpretation of healthcare data. With this flexibility, you can balance factors like accuracy, speed, and cost based on your specific needs. This is enhanced by LangChain’s document processing capabilities, which manage the retrieval system and maintain conversation context, facilitating accurate and relevant responses.
The solution’s data flow begins with medical reports securely stored in Amazon Simple Storage Service (Amazon S3), which are then processed through LangChain’s document handling system. When you interact with the Streamlit frontend, your queries are analyzed by Amazon Bedrock, while LangChain maintains the conversation context and manages document retrieval. The system processes this information and presents results through an intuitive interface featuring interactive visualizations.
These visualizations, powered by Plotly, include range comparison charts that clearly display normal versus actual values, bar charts for parameter comparisons, and trend lines for tracking changes over time. The Streamlit interface ties everything together, providing real-time interaction with the AI system while managing user session state and conversation history. This comprehensive approach helps ensure that medical professionals can quickly access, analyze, and interpret their medical reports through natural language queries while viewing supporting visual data.
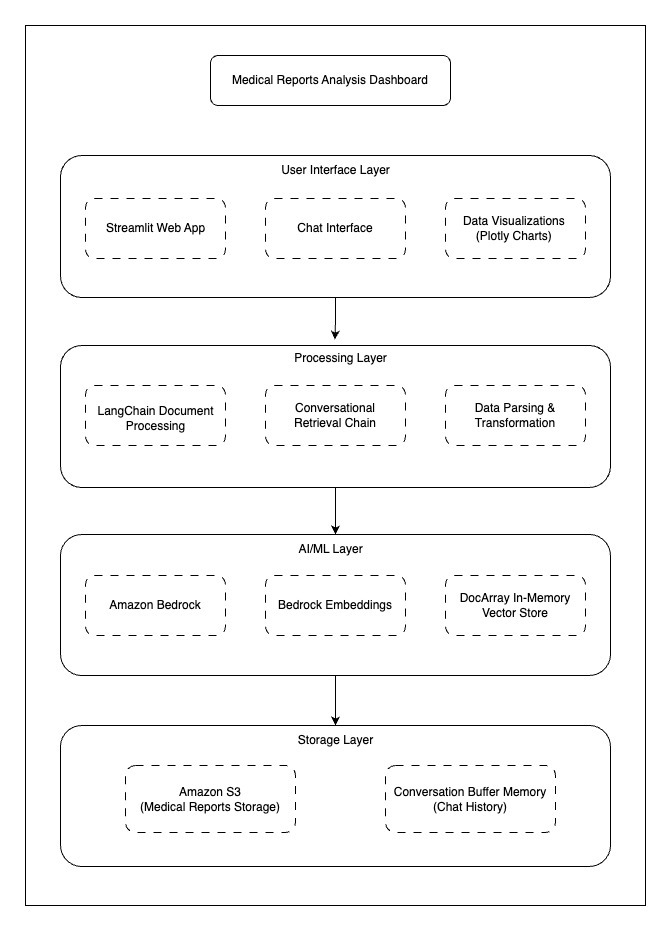
The following is the architecture diagram of the solution that has four layers:
- User Interface Layer: Streamlit Web App, Chat interface, Plotly data visualizations
- Processing Layer: LangChain document processing, Conversation retrieval chain, Data parsing
- AI/ML Layer: Amazon Bedrock, Amazon Bedrock embeddings, In-memory vector store
- Storage Layer: Amazon S3 for medical reports, Conversation buffer memory
Prerequisites
Before deploying the Medical Reports Analysis Dashboard, you need:
- An AWS account with Amazon Bedrock access enabled
- AWS Identity and Access Management (IAM) permission for Amazon Bedrock and Amazon S3
- AWS Command Line Interface (AWS CLI) installed and configured
- An Amazon S3 bucket for storing medical reports in csv format
- Follow Creating a general purpose bucket to create a bucket.
- Sample reports provided are in the following repository. The command needed to upload reports is in the deployment section.
- Python 3.9 or later with pip
- Access to Amazon Bedrock Models. The solution supports multiple models including:
- Anthropic’s Claude series (Opus 4.1, 3.7 Sonnet, Sonnet 4, and so on.)
- Amazon Nova foundation model series (Nova Pro and Nova Lite)
We’ll be using a Python virtual environment (venv) for this project to provide a clean, isolated environment. Virtual environments help avoid package conflicts between projects and make dependency management more straightforward. While we’re using Python’s built-in venv, you could alternatively use miniconda or other environment managers.
Deployment
To get started with deployment, install the necessary packages on a local machine.
- Clone the repository:
- Navigate to the project directory.
- Create and activate a virtual environment (recommended):
For Mac/Linux:
For Windows:
- Update pip to the latest version:
- Install required packages:
Project’s dependencies are listed in requirements.txt:
- boto3
- streamlit
- unstructured
- langchain-aws
- langchain-community
- pandas
- plotly
- numpy
- docarray
These packages will handle AWS integration, web interface, data processing, and visualizations. They’ll be installed in our virtual environment during the deployment process. This setup helps ensure that the components are properly installed and isolated in a virtual environment for optimal performance.
- Follow Configuring environment variables for the AWS CLI to configure AWS credentials.
- Upload sample CSV files to the S3 bucket created in prerequisites section:
Our repository contains two sample files:
basic_test.csv: Complete blood work with 15 parametersblood_test.csvwith basic parameters
The following is the content of basic_test.csv:
Run the following commands to upload sample files to the S3 bucket:
Go to app.py line 68 and update the S3 bucket name in app.py to match your actual S3 bucket name.
- Run the application:
The dashboard will be available at http://localhost:8501. You can now interact with your medical reports through the web interface.
Using the dashboard
This section walks through the key features and demonstrates how to effectively use the dashboard for medical data analysis.
Dashboard interface overview
The following figures show the complete dashboard where the selected medical report is blood_test.csv from the repo showing the navigation pane and main content. The first figure also shows the first two graphs.

The following figure shows the second graph of the three that are included in this dashboard.

The dashboard interface is organized into three main sections for medical report analysis:
- Document selection and model choice (navigation pane)
- Selection of Amazon Bedrock model (for example: Claude Opus 4.1, Claude 3.7 Sonnet, or Amazon Nova Pro)
- List of available medical reports in a dropdown menu
- Currently analyzing
blood_test.csv - Token usage display (input, output, and total tokens)
- Chat analysis section
- Clean chat interface for natural language queries
- History of conversation maintained
- Clear response formatting
- Visualization area
- Range comparison chart showing normal compared to actual values
- Bar chart displaying the parameters
- Trend lines for multiple parameters
Context-aware query system
The dashboard’s AI-powered query system demonstrates sophisticated understanding of medical reports through natural conversations. Here’s a sequence of interactions showing the system’s capabilities.
Question 1: Initial query about hemoglobin:

Question 2: Follow-up question demonstrating context awareness:

Question 3: Complex analysis request:

The system maintains conversation context while providing detailed insights from the medical reports, supporting responses with relevant data visualizations.
The solution can be further enhanced by fine-tuning the foundational model on organization-specific medical data, clinical questions, and domain expertise. This specialized training helps the model better understand medical terminology, standard protocols, and institution-specific practices. Additionally, organizations can use pre-trained medical LLMs available in AWS Marketplace, which are specifically optimized for healthcare use cases. When combined with the system’s existing capabilities, these specialized models can provide contextually relevant responses to medical queries while maintaining compliance with healthcare data governance requirements.
Amazon Bedrock guardrails should be configured to restrict the model from providing medical advice, prescriptions, or diagnoses, making sure responses are limited to data analysis and interpretation only.
Security considerations
While our current deployment uses dummy medical data for demonstration purposes, it’s crucial to consider security and compliance measures for real-world healthcare applications. Here are recommendations for enhancing security in a production environment:
Data privacy:
- HIPAA compliance: Implement HIPAA-compliant practices, including access controls and audit trails.
- Encryption: Use Amazon S3 server-side encryption (SSE-S3) for data at rest and TLS for data in transit.
- Personally identifiable information (PII) protection:
- Apply data masking for PII fields.
- Control data access through role-based permissions.
- Monitor model invocation using CloudWatch Logs and Amazon S3.
- Configure Amazon Bedrock Guardrails. You can use guardrails to also restrict the model from providing medical advice, prescriptions, or diagnoses, limiting responses to data analysis and interpretation only.
- Amazon S3 Configuration: Secure your medical data storage with the following S3 bucket settings
- Enable versioning to maintain a complete audit trail and protect against accidental deletions or modifications
- Block public access at both bucket and account levels
- Implement strict bucket policies that limit access to specific IAM roles and enforce encryption in transit
- Configure encryption (AES-256 or KMS) for all objects uploaded to the bucket
Recommended AWS security implementation:
- IAM roles: Create specific IAM roles following the principle of least for each service
- S3 bucket encryption: Enable default AES-256 encryption for all objects
- Amazon Bedrock API access: Secure access using IAM roles and proper API key management
- Audit logging: Activate AWS CloudTrail for comprehensive API call logging.
- Log data access events on S3 buckets, Amazon Bedrock API calls, and IAM user and role activities
- Monitor and record management events for S3 bucket configuration changes and policy updates
These are general recommendations. For a production healthcare application, consult with security experts and conduct a risk assessment to make sure all relevant compliance standards are met.
Clean up
To avoid ongoing AWS charges, follow these steps to clean up the resources created:
- Delete the created Amazon S3 bucket
- Delete the created local resources:
Conclusion
In this post, we demonstrated the development of a conceptual Medical Reports Analysis Dashboard that combines Amazon Bedrock AI capabilities, LangChain’s document processing, and Streamlit’s interactive visualization features. The solution transforms complex medical data into accessible insights through a context-aware chat system powered by large language models available through Amazon Bedrock and dynamic visualizations of health parameters.
This project showcases how cloud and AI technologies can be applied to healthcare analytics, making medical report interpretation more intuitive and efficient. While our implementation uses dummy data for demonstration purposes, the architecture provides a foundation for building secure, compliance-aligned healthcare applications that can be enhanced to meet healthcare organizational requirements and security protocols.
About the authors
 Aditya Ranjan is a Delivery Consultant with AWS, specializing in distributed systems architecture and cloud-native solutions. He collaborates with customers to design and implement well-architected technical solutions using AWS’s latest technologies, including generative AI services, enabling them to achieve their business goals and objectives.
 Shubham Tiwari is a Solutions Architect at AWS specializing in Modernisation, containers and Security. He has been helping customers in deploying highly scalable, resilient and cost optimised architecture on AWS.